Guide
Carbon dioxide, concentration, and what the evidence really shows.
Outdoor air sits around 420 ppm. A full classroom with the door shut passes 1500 within an hour. Whether that matters is a more interesting question than most articles admit.
Guide
Outdoor air sits around 420 ppm. A full classroom with the door shut passes 1500 within an hour. Whether that matters is a more interesting question than most articles admit.
Carbon dioxide indoors comes almost entirely from the people in the room. It accumulates whenever more is breathed out than the ventilation removes, which is why a meeting room, a bedroom with the door closed, or a classroom after the second lesson all end up somewhere the outside air never goes.
The numbers are easy to state. Outdoor air is around 420 ppm and rising slowly year on year. Building guidance has long treated roughly 1000 ppm as the point at which ventilation is inadequate — not because 1000 ppm is a toxic threshold, but because it was adopted as an indicator that fresh air is not arriving fast enough. Occupied rooms routinely reach 1500 ppm, and poorly ventilated ones go well beyond it.
The reason CO₂ became interesting to people who care about thinking, rather than only to ventilation engineers, is a run of studies from the early 2010s onwards.
A 2012 study from Lawrence Berkeley National Laboratory exposed participants to controlled CO₂ concentrations and tested them on a decision-making instrument. It reported substantial declines at concentrations people encounter in ordinary rooms — around 1000 and 2500 ppm. A 2016 study from Harvard, the COGfx study, found a similar direction of effect in a simulated office environment, and its headline figures were large enough to be widely reported.
If that were the whole literature, the conclusion would be simple. It is not.
Later work has been considerably more mixed. Several studies using different cognitive tasks — particularly simpler, well-practised ones like arithmetic or reaction time — have found small effects or none at all at these concentrations. Reviews of the field have pointed out recurring methodological difficulties: small samples, participants who can often tell which condition they are in, and the awkward fact that in a real building CO₂ never rises on its own.
That last point is the important one, and it cuts both ways. In an occupied room, high CO₂ arrives together with everything else that comes from having people and poor ventilation in a confined space: higher temperature, higher humidity, other exhaled compounds, more noise, more crowding, and usually a later hour of the day. A study that raises CO₂ alone in a chamber is asking a cleaner question than the one you actually care about. A study that measures a real classroom is asking your question but cannot separate the causes.
Here is why the dispute changes less than it looks like it should.
CO₂ is a proxy. What it really tells you is how much of the air in the room has already been through somebody's lungs, and therefore how well the space is ventilated. Ventilation has effects that nobody argues about — on airborne disease transmission, on odour, on perceived stuffiness, and on the reported symptoms people describe as stale-air headaches. If the concentration is high, ventilation is poor, and poor ventilation is worth fixing whether or not the CO₂ molecule itself is what dulls a decision.
And the intervention is close to free. Cross-ventilation — opening windows on two sides for around five minutes between activities — will typically clear a room from well over 1500 ppm back towards outdoor levels. It costs nothing, it takes less time than the argument about whether it works, and it is reversible if you decide it made no difference.
The population studies will never settle the question for one particular person in one particular room. What can settle it is a comparison you run on yourself.
Every Ninug session is tagged with the room reading at the time, and the two groups are compared — sessions where the room stayed below the threshold against sessions where it did not. The comparison is against your own record on the same weekday, not against a published figure, and only sessions with a room sensor present are counted.
We say plainly in the app that CO₂ is itself a proxy, and that stuffy rooms correlate with several other things at once, so some of any effect we show you belongs to those instead. That caveat is in the disclosure attached to the number, not buried in a footnote.
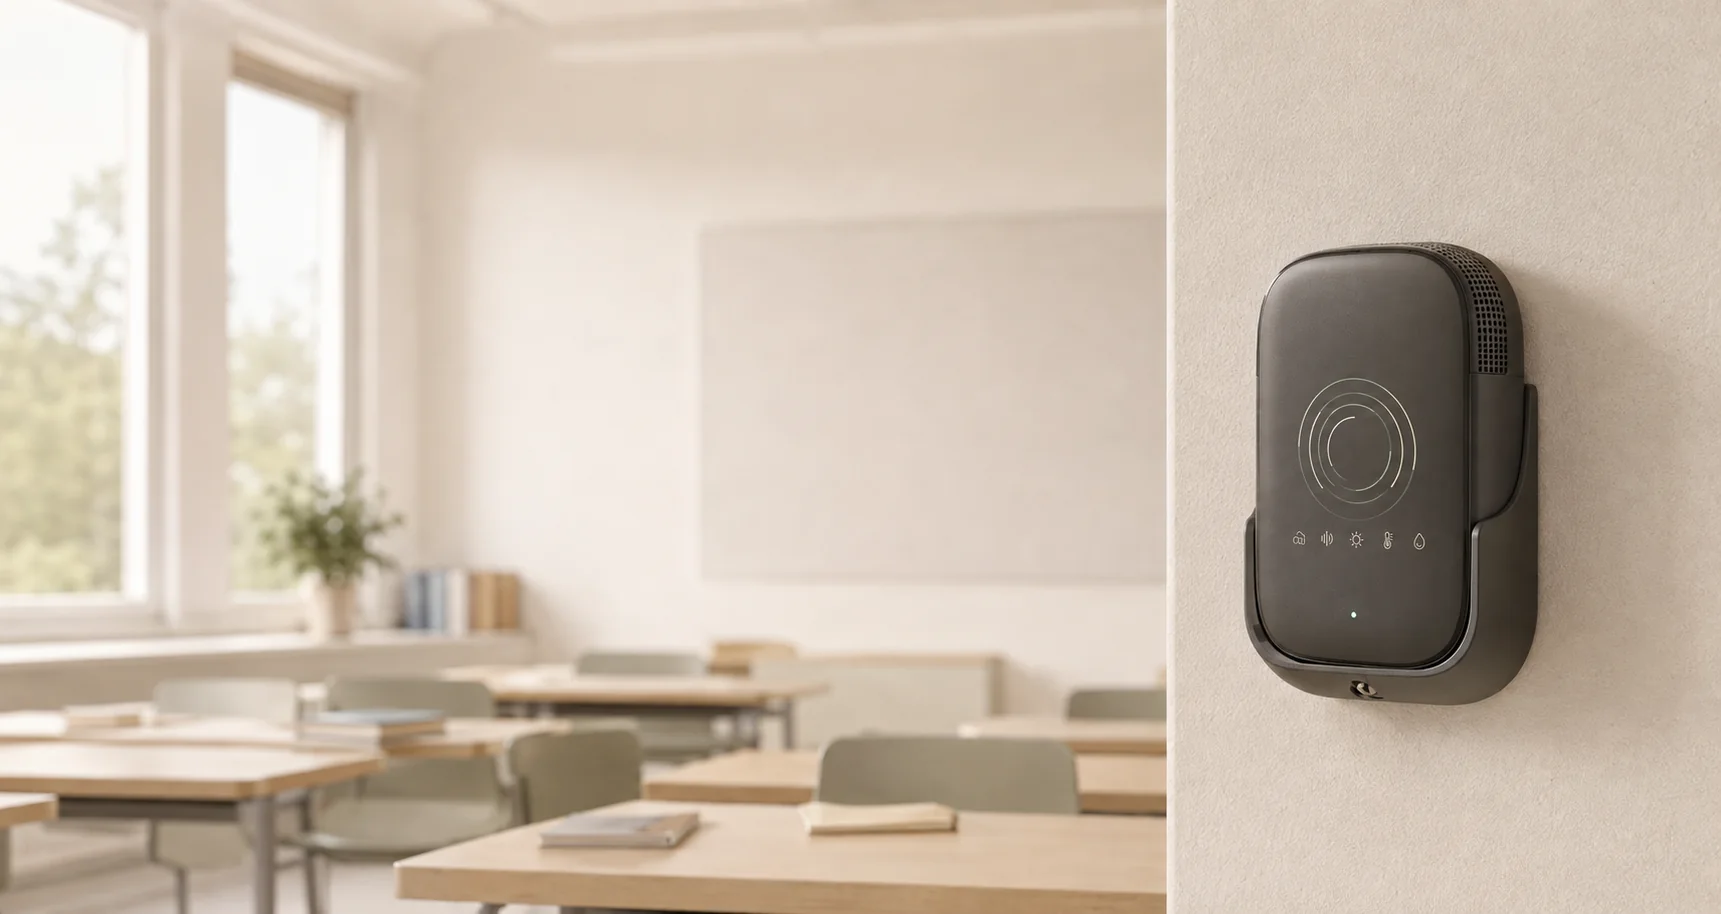
Where this matters most is a room somebody else controls. In a classroom, a teacher can see the air and the light without seeing anything about any individual child — it is a measurement of a building. At a desk, it is the difference between "I could not focus this afternoon" and a curve with a cause on it. Both use the room sensor, which works with or without a band.
Further reading